来源:中考网整理 作者:中考网编辑 2018-09-30 16:23:14
Understanding Graphics(图表)
When we are reading, we often see one or two graphics in a text. Have you ever thought about these questions: Why are they there? What information do they give? Do they help with our reading and understanding?
Graphics are things like pictures, maps, charts and tables. They give information to readers. Very often, we can see different kinds of graphics in books, magazines and newspapers. Writers use graphics to get the readers’ attention and give them some particular(特别的) information. Graphics help to understand the given information in a text. And graphics put the information in a particular order so that it’s easy to understand when we take a quick look.
It is not always true that a picture is worth a thousand words. But many things are easier to show than to tell and they may also be easier to understand. Graphics are just the right things that give a great deal of information but it doesn’t take much time to read and understand.
The right way to read and understand a graphic is to look at the picture and the words together. In a graphic, only a few words are used to explain what the picture shows you. Sometimes, numbers and percentages(百分比) are also given to go with the words to explain things.
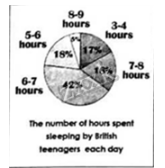
Now look at the graphic on the right. It is how a researcher used a graphic to show the number of hours spent sleeping by British teenagers each day. Can you understand it?

欢迎使用手机、平板等移动设备访问中考网,2025中考一路陪伴同行!>>点击查看
C闂備焦褰冪粔瀵歌姳閿燂拷闂佺懓鐡ㄩ崝娆撳礂閿燂拷闂傚倵鍋撻柟绋挎捣閻擄拷闂傚倵鍋撻柟绋垮琚�
S婵炴垶鎸搁敃銉╁箲閿燂拷濠电儑绲藉畷顒€锕㈤敓锟�闂佽壈顕х换鎰玻閿燂拷濠电偛鑻悧鎾澄i敓锟�闂佹椿鍘奸崯鍧楊敊瀹ュ棙鍎熼柨鐕傛嫹